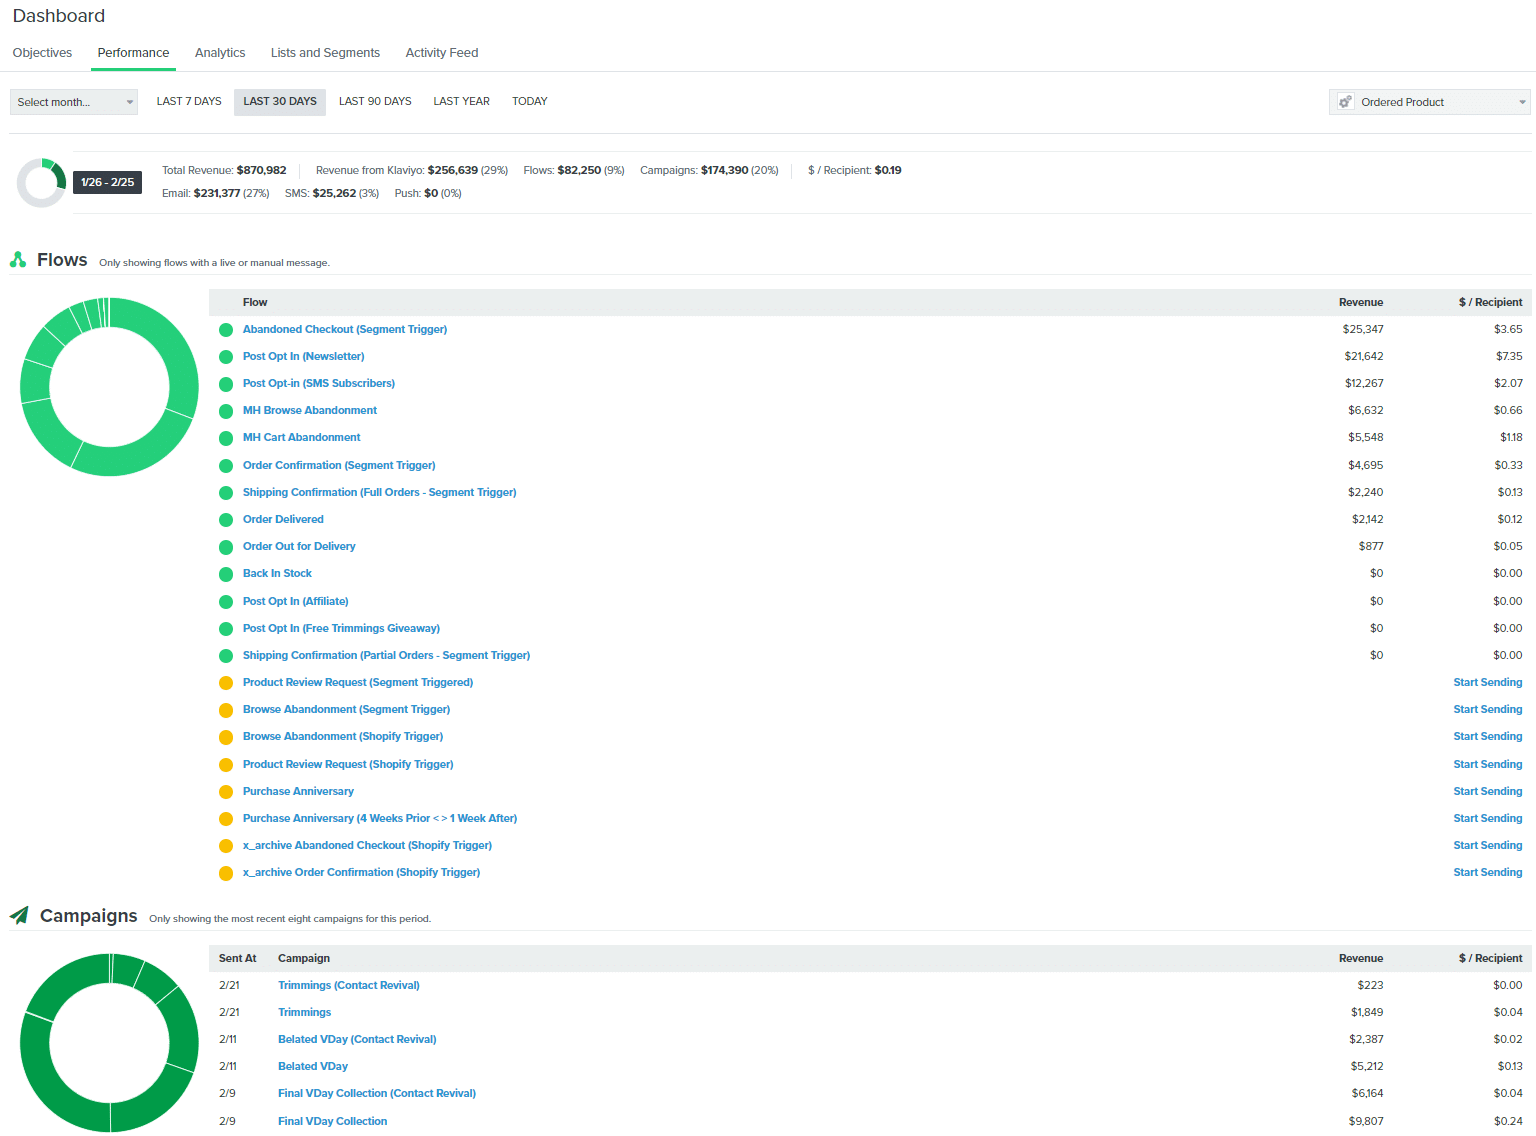
Klaviyo makes creating scalable email and SMS strategies extremely simple, but where it really makes its mark is in it’s simple reporting capabilities. After all, having a tool to send messages to subscribers is one thing, but actually evaluating success of those efforts is critical to growth and sustainability. Klaviyo puts the reporting right in front of you to see in it’s performance dashboard – a high level overview of the revenue (or other metrics you might be interested in like website activity) that they define as attributed to messaging sent from Klaviyo.
Each of these metrics is helpful in evaluating how successful your email and SMS program is in Klaviyo, but to understand how to improve it, we need to understand what all of these metrics actually mean in context. Marketing data is not scientific data, and context is important to approach the next steps in a tactically sound manner.
In this blog post, we’ll share key information on the basics of the dashboard, but we’ll also share a few things to think about for your specific Klaviyo account as they pertain to each metric.
How Klaviyo Defines Attribution
Speaking of context and marketing data not being scientific data – let’s first define how Klaviyo defines attribution. For every message you send, Klaviyo will automatically calculate attribution for you.
You can get the full breakdown of how Klaviyo defines it here, but the key points are:
- A conversion occurs when a recipient opens your message and then takes another action (such as placing an order) within the conversion period.
- Out of the box, the conversion window on a Klaviyo message is set to 5 days. This means if someone engages with your email or SMS and orders within 5 days, Klaviyo will attribute the revenue to the message.
- Conversion tracking uses a last-touch attribution model. Only the last email someone opened or clicked is credited with a conversion.
Klaviyo’s Attribution Settings
Within Klaviyo’s attribution settings you have a couple of options to control what you want to define as messaging attributed to Klaviyo.
The attribution window length
The attribution window itself which is set to 5 days by default. How many days between a message send and a conversion should you allow for? Obviously, giving someone months and months between an engagement with your email and a conversion is extreme, but consider how much other marketing you’re doing and what your sales funnel looks like before setting this up.
The attribution engagement trigger
By default, a conversion is tracked with attribution to Klaviyo if a recipient opens an email. This can make sense to allow for someone to have seen an email from you on their phone and then later went on their laptop or tablet to go shop and convert. But it can also bring in doubt about how much an open is really worth in your conversion funnel. You can update this attribution engagement trigger to leverage clicks instead, but then you are essentially stating that the content of your emails ads zero value to your conversion. There’s no explicit right answer for everyone here.
The ability to exclude MPP opens from attributing
Adding to the complexity of the attribution question is Apple’s Mail Privacy Protection (MPP) triggered opens. The TL:DR – Apple allows it’s mail users to effectively hide pixel tracking of email engagement. The default behavior is to automatically trigger an email open each time an email is sent to the user, regardless of whether or not they actually opened. Ultimately this gives you a little bit more control in more accurately attributing conversions to emails that actually get opened.
You can read more about MPP here.
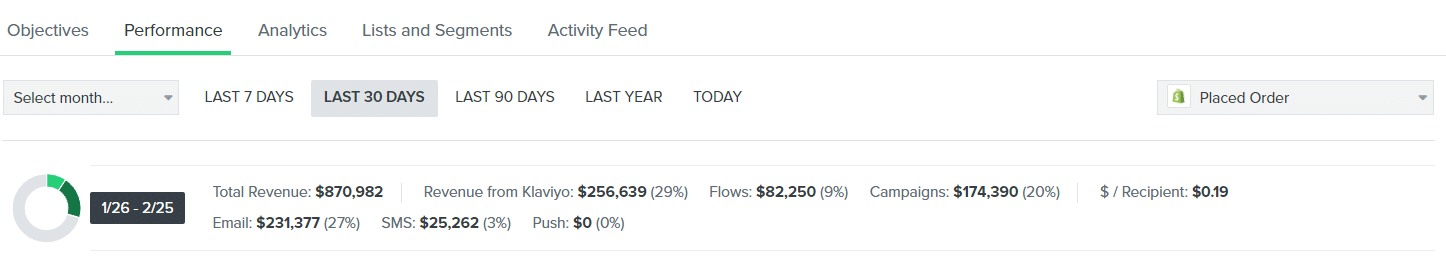
The Top Line Klaviyo Performance Dashboard Metrics
The Conversion Metric
The conversion metric drop down is what metric we’re actually wanting to evaluate. For many of you reading this, Shopify’s Placed Order event is likely the main KPI you are evaluating. However, Klaviyo’s drop down options allow you to pick a variety of conversion events to see how you’re performing. Want to be able to measure how your emails are driving website activity? Choose the “Active on Site” event and see how email is contributing.
Simply choosing a “Placed Order” event will give you part of the picture, but you may want to consider a few other things. Placed Order for example includes shipping costs, but also removes item discounts. If your products require heavy configuration to place an order (i.e., lots of options to choose before you’re able to check out, you may instead want to think about looking at the Viewed Product event as part of your KPI criteria, as your product page will have an outsized impact on the conversion. The same can also be said for stores with large catalogs with limited quantities. You can’t drive everyone to order the same product, and therefore driving site activity to shop your catalog may be another criteria to evaluate.
For the rest of the metrics, we’ll be speaking to conversion events that have a revenue value associated with it, but you can still look at all these additional conversions and how they’re attributed to various messages in Klaviyo.
The Conversion Date Range
Not much needs to be said for the Conversion date range. Pick the appropriate dates you want to evaluate and see how many of your selected conversion metrics occurred in the window, and how many were attributed to Klaviyo.
When leveraging the date range, outside of obvious raw conversion trends, think about any potential seasonality of your business, any impacts to your inventory, big promotion periods (Black Friday of course), and list growth/decay across the timeframe.
Total Revenue and Revenue from Klaviyo
While Total Revenue is another straight forward metric to track, the Revenue from Klaviyo percentage is the most commonly leveraged KPI to evaluate success, and the one most people use to evaluate email marketing agency case studies. Obviously more Revenue from Klaviyo means your email and SMS programs are improving, but how much revenue should we be driving?
The answer to that depends on a few things. What if you’re leveraging click-based conversion attribution instead of open-based? What if you have a lead magnet on your site offering a 10% off promo sent via email when you sign up? What if you only sell one product? This can be a complicated metric to track and determine what a “strong” percentage of revenue generated from Klaviyo. Keep in mind that if you are leveraging conversion events not associated with a revenue amount, you can still see the breakdown in conversions via Klaviyo.
To understand more on how to evaluate the percentage of revenue generated from Klaviyo, check out our blog post dedicated to it here.
Revenue from Flows and Revenue from Campaigns
The revenue attributed here corresponds to the revenue generated by your automated messaging (flows) and the revenue generated from your one-off messaging (campaigns). Evaluating these metrics, much like that of overall revenue from Klaviyo, needs to be done with proper context.
At MH Digital, we prefer to see a mostly balanced percentage of revenue coming from flows and campaigns for a handful of reasons. Automated flows triggered from user behaviors tend to have markedly better engagement and conversions on a per-recipient basis. But having some regular marketing campaigns is a good sign that the brand is coming up with fresh marketing content, new products, or other growth initiatives.
In an ideal world, we’d automate all of our messaging, so that we could simply rake in the revenue and spend our time elsewhere. But not everyone can be captured with automated messaging, and you’ve got new products to announce, sales to run, and new content to share. While automation is good, it’s not that good (yet).
If you solely focus on maximizing revenue from email and SMS at all costs, you are likely in a position to be over-sending one-off campaigns. When this happens, most Klaviyo accounts begin to over-send campaigns to their lists, which can fatigue your audience and lead to poor list hygiene practices. When this happens, you see 2 additional things happen: an increase in promotions/discounts and a increased risk of deliverability issues. If you’re seeing an oversized proportion of your revenue coming from campaigns instead of flows, you will need to start re-evaluating your strategy.
For a deeper understanding of determining the right balance for your klaviyo account, check out our guide on revenue from campaigns vs flows in Klaviyo.
Revenue per Recipient
Revenue per Recipient is the overall revenue per email recipient over the specified time range. How much revenue should you be generating per email recipient? Again, another set of questions needs to be asked to evaluate this metric. If you are a company that sells one flagship product and not much else, then your email and SMS messages should not be conversion focused. Instead, have a look at what else you can send to your subscribers.
Ultimately, evaluating this metric should first done to understand how much of your messaging is content driven vs revenue driven. There’s nothing wrong with sending emails that don’t drive conversions or revenue. We recommend maintaining a healthy balance to keep your audience engaged.
This metric is best used in conjunction with other deliverability monitoring to ensure a healthy email database. If you’re honest about the type of messages you’re sending, then keep an eye on the trends of this and use it to further dial in your segmentation for your campaigns, or to re-shape your overall messaging strategy.
Learn more about how we think about revenue per recipient here.
Channel Specific Revenue (Email, SMS, & Push)
Another straight forward metric here, the breakdown of revenue across email, SMS, and push messaging can help you understand the distribution of where conversions are taking place. There is a growing rise in interest of SMS as a marketing channel (we’re constantly getting asked about it). While SMS tends to have higher engagement than the email channel, it’s recipients are much less tolerant of messages that do not interest them and are quicker to unsubscribe.
The key thing to think about with these metrics is to understand the intrusiveness of each channel and the available content you can put in each message so as to build a messaging plan. In most cases, there’s no one-size-fits-all recommendation on the breakdown in revenue for each.
The Flow and Campaign Activity Snapshots
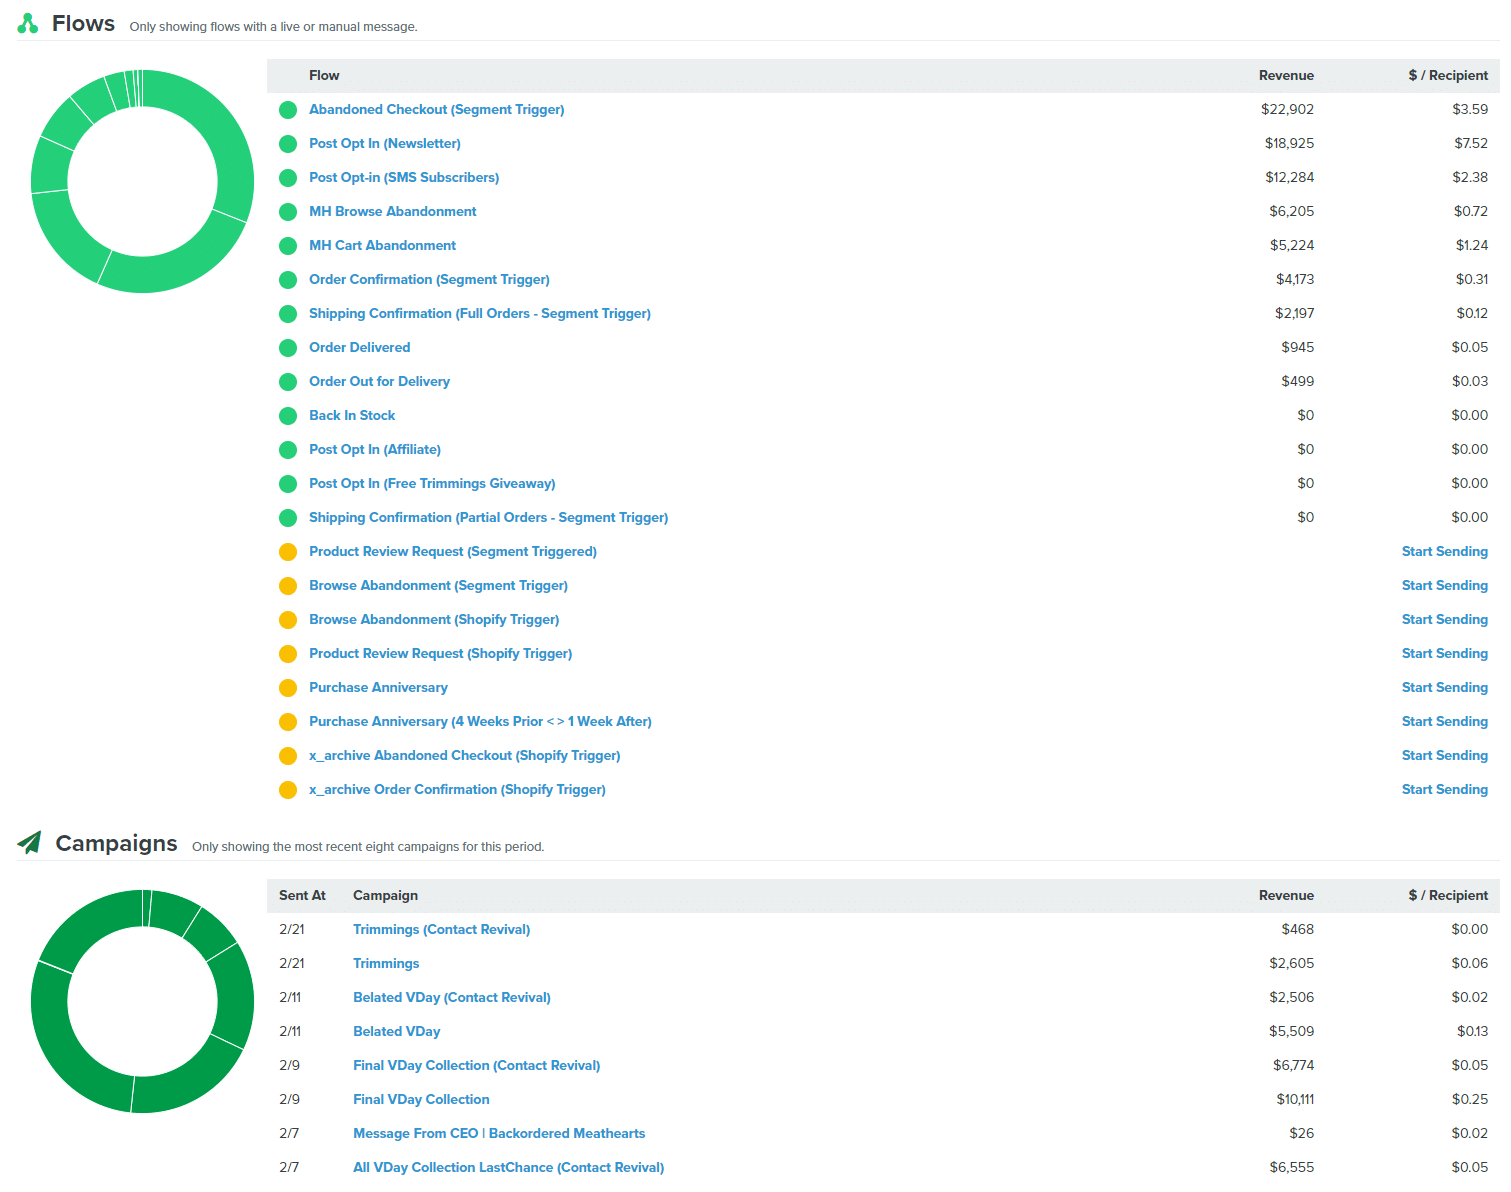
The rest of the Klaviyo Performance Dashboard is dedicated to a slightly deeper evaluation of your Flow and Campaign revenue and revenue per recipient broken down by each flow or campaign across the specified date range. The first thing that will probably jump out to you is that you are likely to have a few key flows that generate a lot of revenue (Cart Abandonment and Welcome Series tend to stick out here), and a handful of others that don’t. In particular, have a look at the revenue per recipient for those flows and how they compare to your average campaign revenue per recipient. In many cases, it’ll be an order of magnitude better. This is another reason that building in as much flow based messaging as you realistically can will do great things for the health of your email and SMS program in Klaviyo.
The Flow Activity Snapshot will also give you a look at one of the issues with Klaviyo attribution if you’re using transactional messaging set up in Klaviyo. Just like in our example screenshot, you’ll see revenue being attributed to the Order Confirmation flow. In theory, could an order confirmation email been the reason someone went back and decided to buy something again? Maybe. But it’s unlikely that we should be attributing real revenue to that type of message. In any case, this point is made to show that these metrics all have limitations in their accuracy.
The other thing to use the Flow Activity Snapshot for is a quick look in making sure your flows are actually doing what they’re supposed to do. Have an issue with your Viewed Product event and now your Browse Abandonment flow won’t trigger emails? You’ll likely see this impact in the revenue generated by that flow when looking at month to month stats for the Flow Activity Snapshot.
A final note on Klaviyo reporting accuracy
With the the lack of finely manicured attribution options in Klaviyo, along with some of the edge cases like the one we mentioned in the previous section about an Order Confirmation email being attributed conversions, it’s easy to want to perfect an attribution model to get perfect reliance on every single stat Klaviyo is tracking. At MH Digital, we’ve seen a lot of clients try to chase attribution perfection and it’s something that will never be perfect. Typically, we look at these performance dashboard metrics as Klaviyo’s contribution to conversion, not explicit attribution. While some marketing channels will certainly be better than others for different stages in the marketing funnel, there will likely always be some mixed-model attribution that is better than what Klaviyo reports.
Instead of obsessing over the perfect attribution model, treat Klaviyo’s reporting more for trend analysis than for matter of fact reporting – that is, evaluate based on changes to your metrics over time or relatively, not absolutely. This will help keep you from going down endless rabbit holes, and likely keep you focused on evaluating the metrics in proper context, which is key to email and SMS marketing success in Klaviyo.
Now that you understand what these Performance Dashboard metrics do and some context around them, do you need some help in evaluating the Klaviyo Performance for your account?